After posting the PMC for a full 28 week training plan in another thread, I thought it might be useful if I posted a few more of them here.
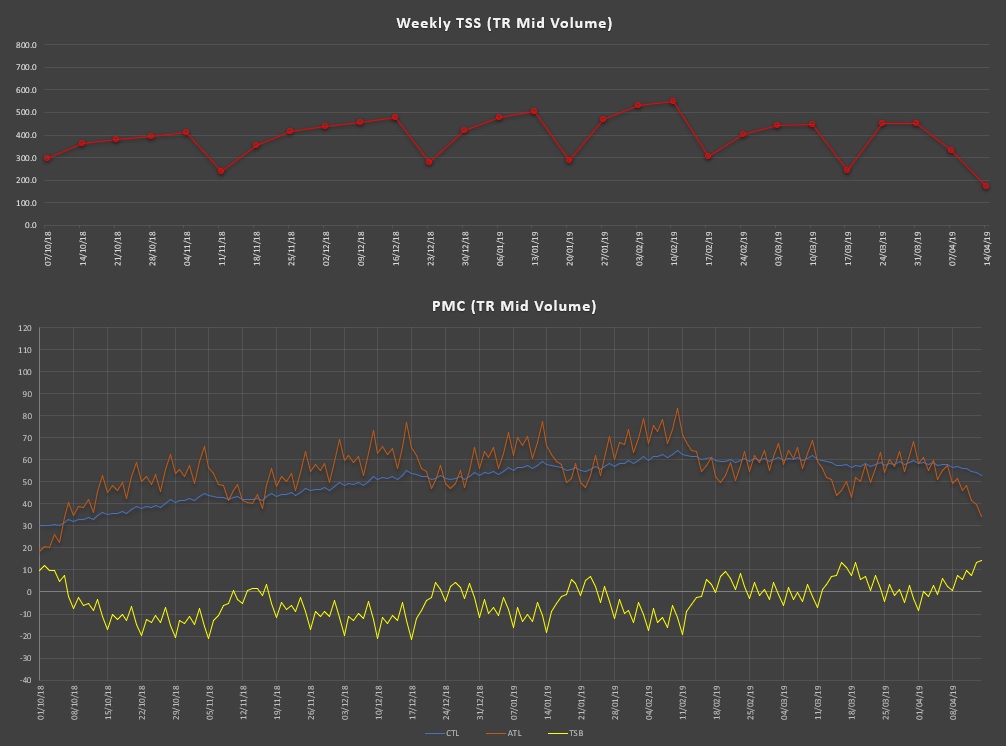
The first three plans are Sweet Spot Base 1 > Sweet Spot Base 2 > General Build > Climbing Road Race in low, mid and high volumes.
I’ve plotted the low volume plan assuming zero fitness on day one, the mid volume plan following on directly from the low volume plan (to give a reasonable starting CTL and ATL). High volume follows on from the mid volume plan also.
The top half of each graph is the weekly TSS with the PMC below. All graphs are on the same scale to make them easier to compare.
Sweet Spot Base 1 > Sweet Spot Base 2 > General Build > Climbing Road Race - Low Volume
Mike you have just saved me the rest of my Saturday. I’ve literally been re-entering my TR season into TP workout by workout manually and forecasting the next year so that I could see on the PMC what my TSB was going to do so that I could ensure peaking in the right spots (not always intuitive when just looking at the TSS in calendar mode).
@Nate_Pearson i know a few have asked for this feature already, but if you guys could somehow integrate some of this info into your setup you would completely remove anyones need for GC or TP if they are solely a cyclist. Please please please.
The PMC was literally the only reason I was a TrainingPeaks subscriber. I’ve since cancelled my TP membership, bu I do miss the nitty gritty detail of CTL, ATL, CIL and TSB, flawed/incomplete as they are…
Thank you! I had a library of TR SSB workouts (TSS, duration) on TP and was doing that analysis until I let premium lapse last weekend. Would appreciate you making the spreadsheets available.
These charts were one of two features keeping me with TrainingPeaks Premium. The other is the customisable time in zones chart. Not sure the second is so easy to do in a spreadsheet.
Great job, @themagicspanner It’s really quite clear how TSB is cyclical, with decreased cycle time as of the build phase, and a more levelled TSB from the speciality phase, around 0. Love it.
I agree with this. I can keep it simple by following my TR plan, as Chad & co have done the thinking already to progress me well to my goal event. I can trust them. Calendar gives me some broader indications of training load. If I have to adjust the plan, e.g. cannot train for a week or have extra time, I can make some ad-hoc decisions.
Yeah, it’s more that I don’t really want to go to the bother of having to process every workout. Easy enough to type a TSS value into a single spreadsheet.
I found a PMC spreadsheet free on the internet on one of the triathlon training sites i use (maybe Coach Cox’s website). I use it rather than Training Peaks. Hope this helps.
Stravistix (now called Elevate) should be mentioned too I guess. It’s a browser add-on for Chrome (maybe other browsers) that interfaces with Strava to provide extended activity metrics. One of its features is a PMC that they call the “Fitness Trend”. I’ve attached a screenshot of my current chart. They have also recently implemented FTP tracking, so it should actually be accurate (unlike Strava’s flawed “Fitness & Freshness” chart, which does not take into account FTP changes).
Important note: There’s no way to project your future workouts onto the PMC with Elevate. But otherwise, it seems legit.
People using TP may find this helpful. It’s a link to some code that allows you to input your TR workout plan into your TP calendar so you can project fitness using the PMC.