I promised in another topic to do some analysis based on the results of respiratory gas analysis during a ramp test I’m doing as a part of my annual health check. The sports testing center I’m doing my checks is kind enough to provide me all the raw data, so I was able to nerd out a bit and reach some interesting conclusions.
Both tests were done at the same lab, using the same equipment - all the data, including power comes from the same source.
Based on the VO2 and VCO2 volume, I was able to calculate the fat (FT) and carbs (CHO) metabolism at various levels of effort and compare both years.
March 2017 test - 189cm, 75kg
The test followed a 4 month period of very focused training - I started in November 2016 after a bike crash, did a vast majority of my rides inside and 95% of my workouts were done fasted. The main training blocks I did we sweet spot base 1 and 2 on TR. In terms of diet, I kept my macros in check throughout the whole period - no refined sugars, 30% protein, 20% fat, 50% carbs.
June 2018 - 189cm, 77kg
I changed jobs in October 2017, I was riding lots but none of that was structured. The main reason was simply flying back and forth between California and Europe and a resulting jet lag at least twice a month - my new job gave me the opportunity to ride my bike in loads of cool places, I made a few efforts to structure my workouts but essentially I rode on TR when I was not able to take my bike with me on work trips on when I was back at home “enjoying” the European winter. TR workouts were sporadic and not structured. My diet was probably the biggest issue - I keep relatively clean, but even my short workouts were fueled by copious amounts of carbs, outdoor rides were mostly fueled by ice cream and cake (I blame the Californian cycling culture for that!).
Here’s how the both base phases looked like in terms of structure:

*November/December 2016 - I was testing other indoor platforms back then, all rides were indoor but they show as other on TR. I was following the Racing Weight Quick Start Guide 6 week plan.
And here’s how this affected my metabolism on the bike:
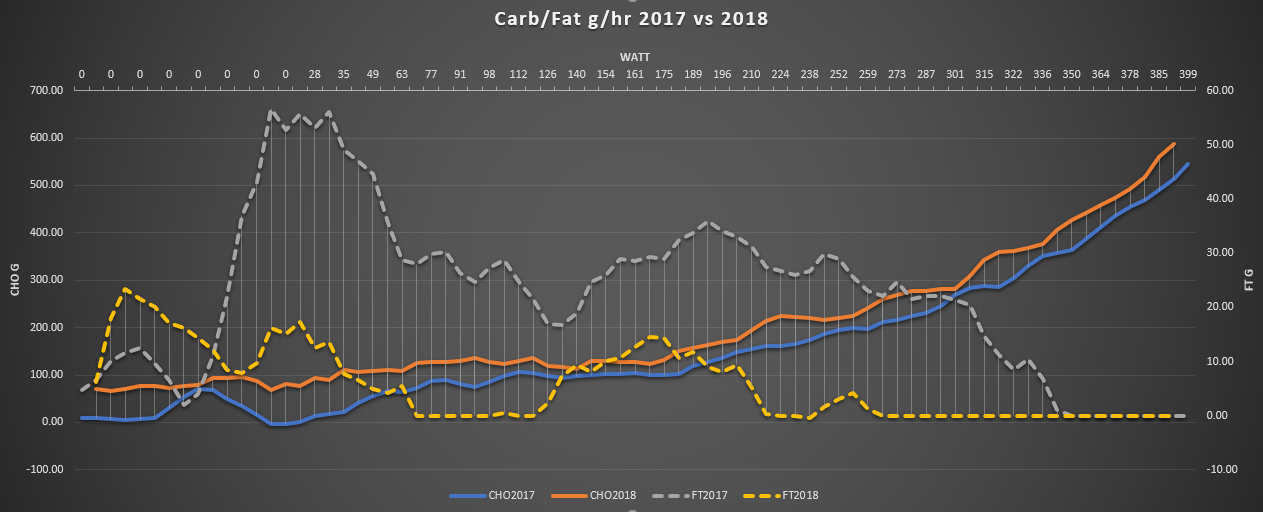
I did the 2017 test 3 hours after easily digestible lunch, in 2018 I did have one caffeinated energy gel just before the test and I had an energy drink in my bottle.
As you can see, the results are quite dramatically different, my FTP in both cases was approx 310W, but in 2018 I was burning huge quantities of carbs just from the beginning, which resulted in some pretty miserable performances during the few races I participated at.

Below is the link to the full calculations just in case someone is interested, I did some digging to get to a decent research on the subject, but it’s possible I made errors in my calculations. If that’s the case, feel free to correct me.
https://drive.google.com/file/d/0B8gO4R0-gQCrbWVJQ1dPdVVmMFNUWm9pcGFvdTFESFFmeWVz/view?usp=sharing


