This making me feel better. At one time I was concerned about loosing all the power PBs from TP from 5+ years ago. However, now these don’t seem relevant. Has anyone looked at extracting data from TP? Last time I looked it was a PITA.
I just downloaded ride data from TP, one year at a time. Wasn’t hard, only took 5 minutes.
I tried the trial versions of TR and TP and opted for TR. I’d been thru a bad year of injuries and TR provided the focus to recovering and I like their attitude (and it knocked 45mins off my local Fondo)…and now the calendar means I no longer need my excel spreadsheet :).
I’m also not renewing my Strava account this year…I use Golden Cheetah instead for tracking data…it satisfies the nerd in me. And it’s free.
1 Like
My TrainingPeaks subscription is up at the end of the month. I won’t be renewing. I’m not renwing Strava either but I’ll keep using the free version. Don’t forget to download your historical data from TrainingPeaks if you do ditch it!
Not cancelling TP. I can create my workouts inside of TP which auto syncs to my Wahoo Elemnt Bolt. Then I have my workouts with power targets, etc. there with auto lap functionality for completing intervals on outside rides. I know TR has “trainer” in the name but I’ll be doing my workouts outside 5-6 days per week when the weather allows and I don’t want to go back to writing my intervals on a piece of painters tape on my top tube.
When the complete that functionality I might switch but I need the Performance Manager Chart tracking CTL at minimum, not just TSS. I’m sure they will get there but not yet.
I’ve using WKO4 trial and now TP free edition, they work well together. And try as I might over the last year, GC is a little too rough around the edges for my tastes. I’ve been in open-source software industry for 10 years, and am happy to use ‘free as in beer’ but when my time is a consideration I don’t mind paying for commercial software. Wish I had time to contribute to GC project, the ‘free as in speech’ side of it, but that isn’t happening anytime soon unless I win the lottery.
I’m addicted to the fatigue/fitness/form tracking in TP. When TR releases their replacement for that, I will cancel TP.
19 Likes
You know CTL (a.k.a. “fitness”) is six week rolling average of your daily TSS, just like the six week rolling average of your daily TSS displayed on the TrainerRoad career page? The only difference is it’s exponentially weighted so places a bit more weight on your more recent activities, but the lack of precision in the information CTL tries to capture (i.e. your fitness) means they can be used in the same way.
1 Like
So I have to pull a calculator out and graph it in an Excel spreadsheet? No thank you. Is that what you mean?
I agree, the addictive nature of the performance management chart decreased once I realised the numbers don’t correspond to what I feel (and my measured ftp) after sustained indoor training. I think @chad talked about this in one of the earlier podcasts?
1 Like
No, I’m mean TrainerRoad gives you this information. Admittedly TrainerRoad doesn’t plot this value, they plot the rolling weekly average over the preceding six weeks, but this is more-or-less the same thing - the weekly average will be on a different scale and be less volotile, but gives you broadly the same information.

What TrainerRoad doesn’t give you is your ATL, which is the exponentially weighted average over the last seven days. However, practically this isn’t any ore helpful than your total TSS for the week.
2 Likes
And yes, I did deliberately choose a period over the summer when I was training a lot for that screenshot!!
12 Likes
I’d forgotten about the TP / bolt workout creator… but then I have actually used it once, and I had little success in matching the actual intervals outside with the plan I made on the sofa. I’ve had more success in planning routes which approximately match the equivalent TR workout. And not a lot of success in that either.
Interesting. I imported all my rides and just compared it to trainingpeaks and it is tracking to the CTL shown in TP. TR is showing like 80 for my highest but TP is 90 for the same week.
Interesting. No, I didn’t realize this was there because I never go to the website, I just use the app. Thanks for sharing.
It’s weekly and not daily, but I compared it to my TP data and they don’t match up very well over time. Either way, I guess it’s just a metric and I could change from one metric to the other, but being honest, I get a ton of value from that simple chart on the TP app. I can see when i need to worry about overtraining/getting sick. I can motivate myself for a big day if i see what it’s going to do to my daily average over the next few weeks, etc., and I can look at it any time I want by just opening he app. It motivates me, and for that reason, it’s going to be hard to let go. Now…is it worth $100 a year…
Mac/Windows should be pretty good by then if we execute well.
Make extra yams and green beans please!
4 Likes
@Bikeguy0 The TP rolling average will be more sensitive to your most recent week or two as it’s more heavily weighted in that direction, so it will be slightly more variable, but in general it’s howing you the same thing.
@Pbase I’m not sure what you mean? TR show weekly and daily averages, but they only plot the weekly. As with the daily average, because TP weight recent weeks more heavily their rolling average will be more sensitive to your recent efforts and thus will be more variable. For example, you will see a larger drop after a recovery week.
I finally cancelled Zwift.
Sticking with TrainerRoad from now on.
5 Likes
I am not sure if you have a garmin device but if you do you can use live tracking via there app for free. I am sure you knew this already though.
Here is 2018 side-by-side, using WKO4 trial version because my TP premium expired a few days ago.
The numbers aren’t exactly the same, but they both show lowest CTL / 6-week-avg the same week in August.

and PMC in WKO4 (basically the same as TP app or web):
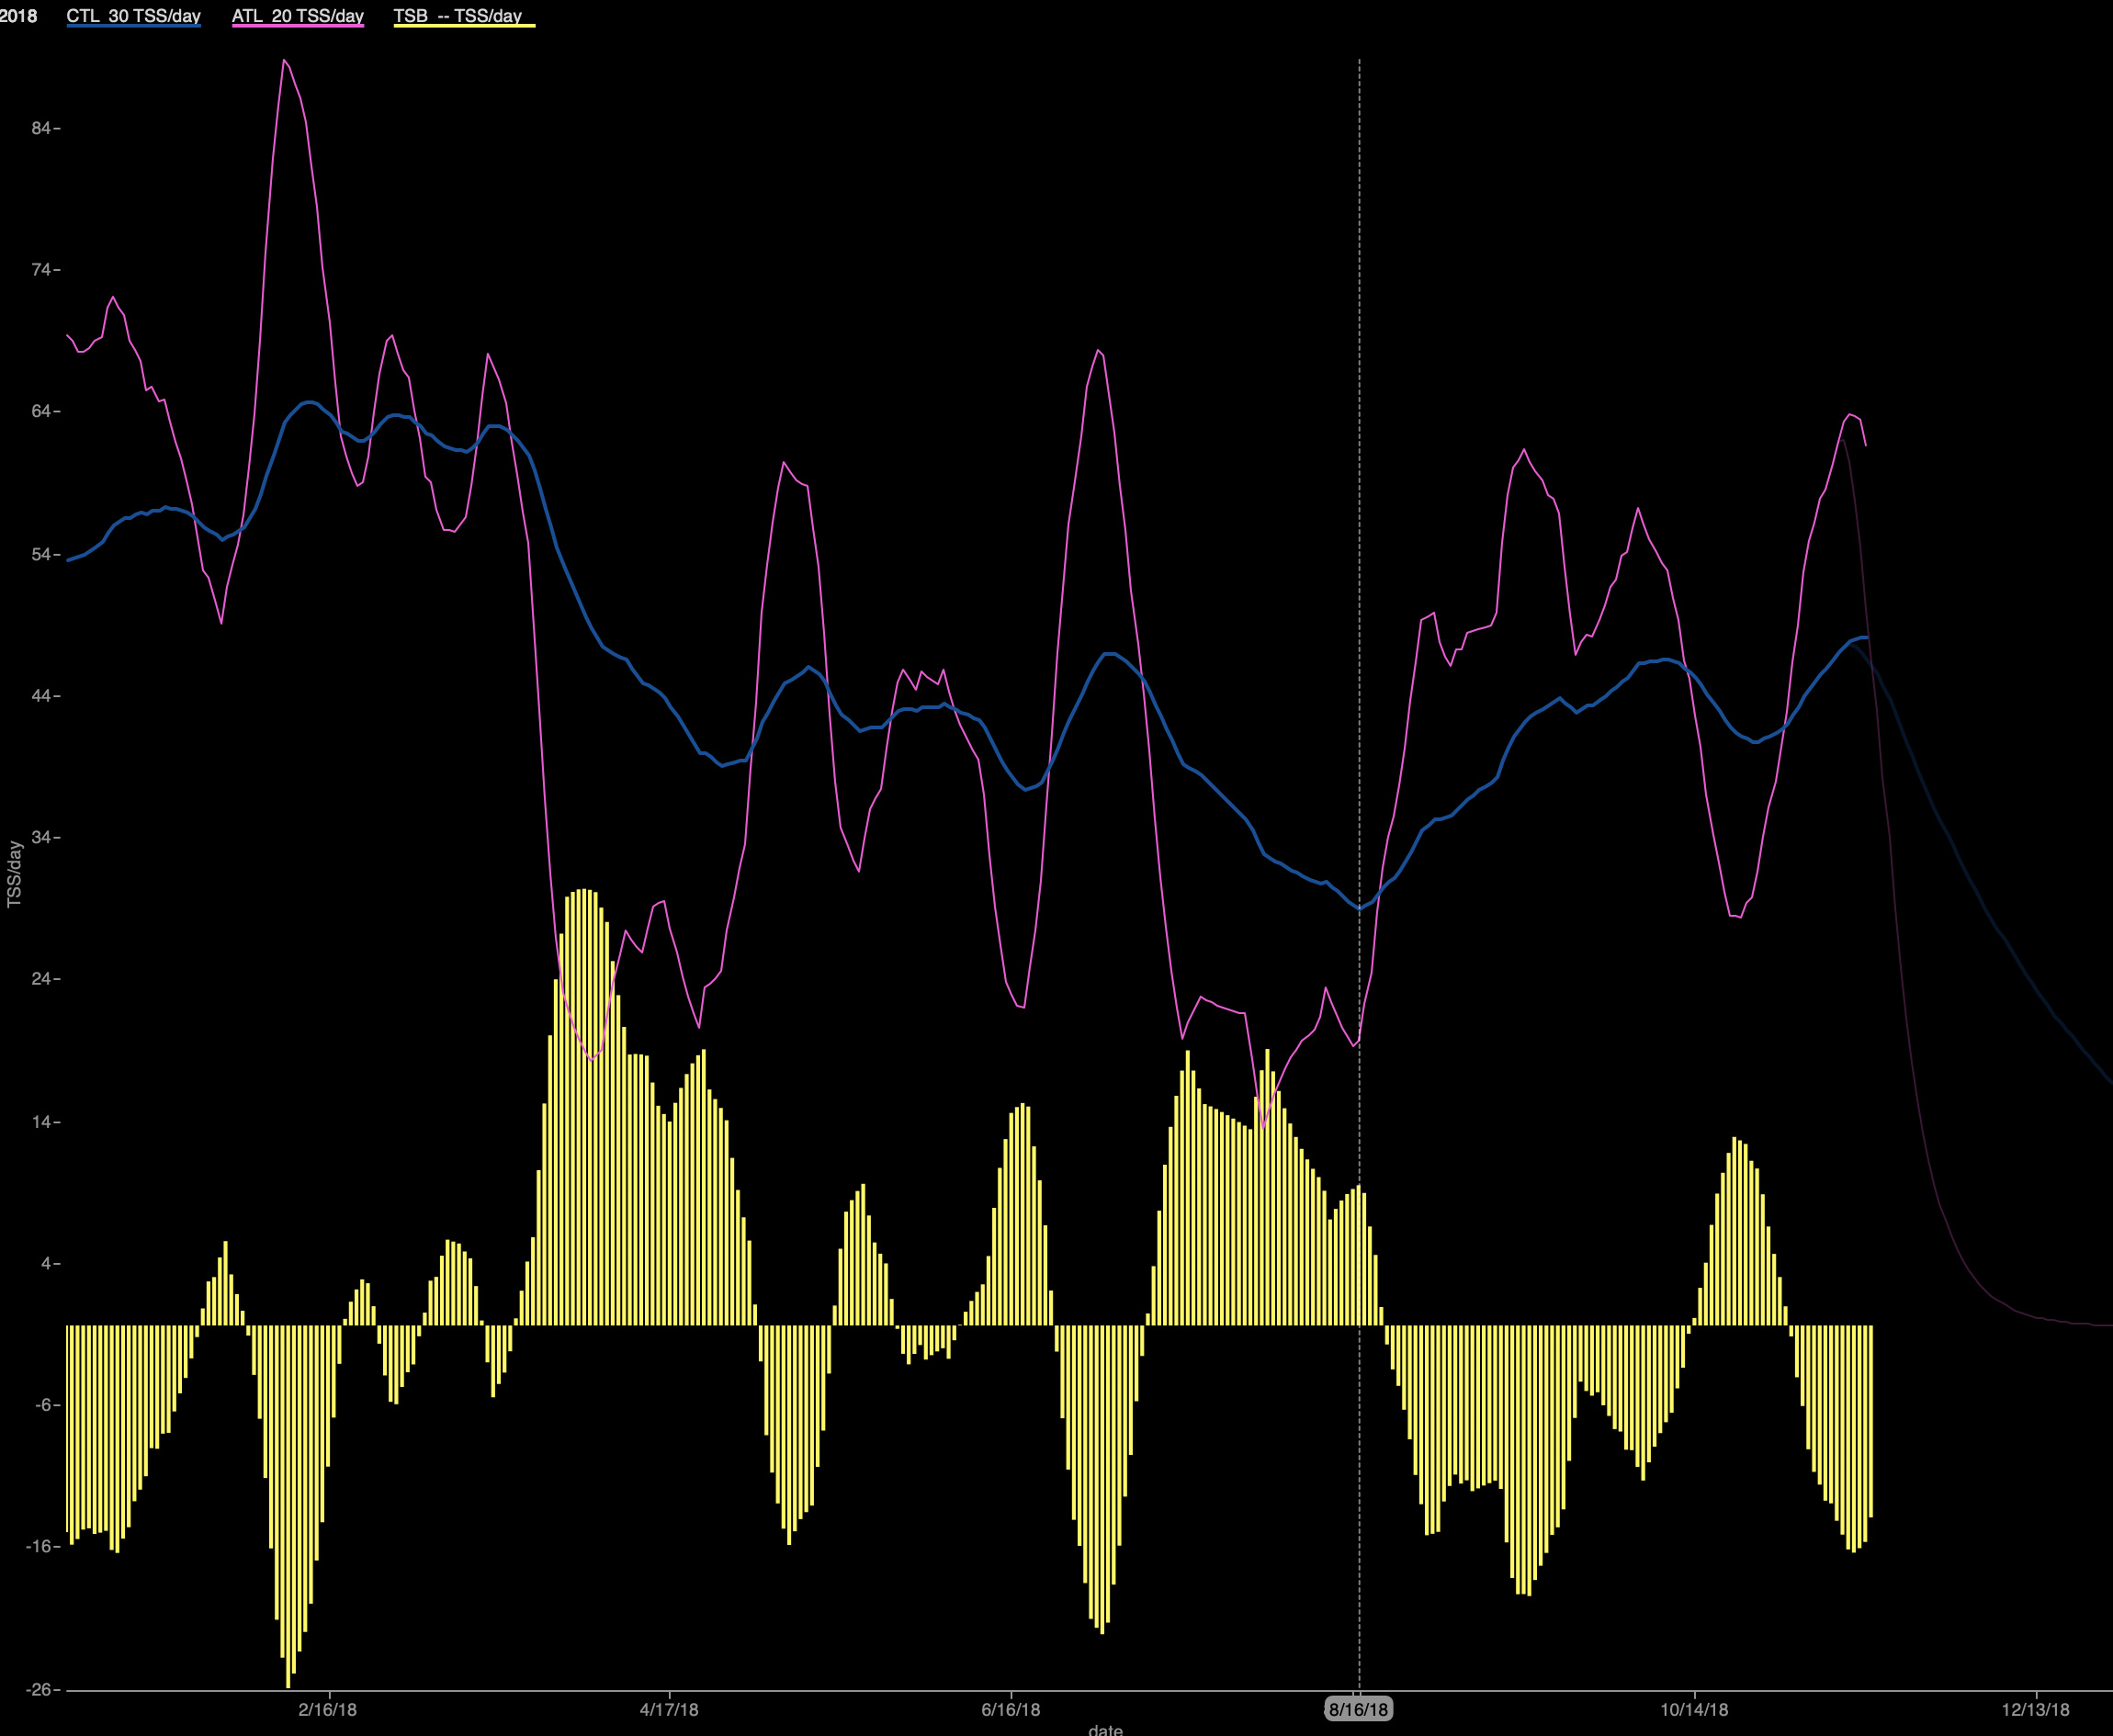
The blue line in PMC is basically the same as dark line in TR chart.
I’ve always found the TP PMC chart to be incredibly busy, almost to the point of making it difficult to look at trends. On a positive note, in about 5 minutes I figured out how to make my own chart in WKO4 and hide ATL and TSB.
I’m happy enough with TR to drop TP Premium, however I may buy WKO4 because it lets you dig deeper into the data and customize charts.
1 Like